Showing posts with label NASA. Show all posts

Wednesday, December 23, 2015

Ever wonder if there are any measurable health issues or problems from exposure to Smart Meters and the electromagnetic frequencies they emit? The answer is , YES!


Activist Post

Interrupt Your Regularly Scheduled Program


Red Blood Cells and Smart Meters

smart_meter_blood

By Catherine J. Frompovich

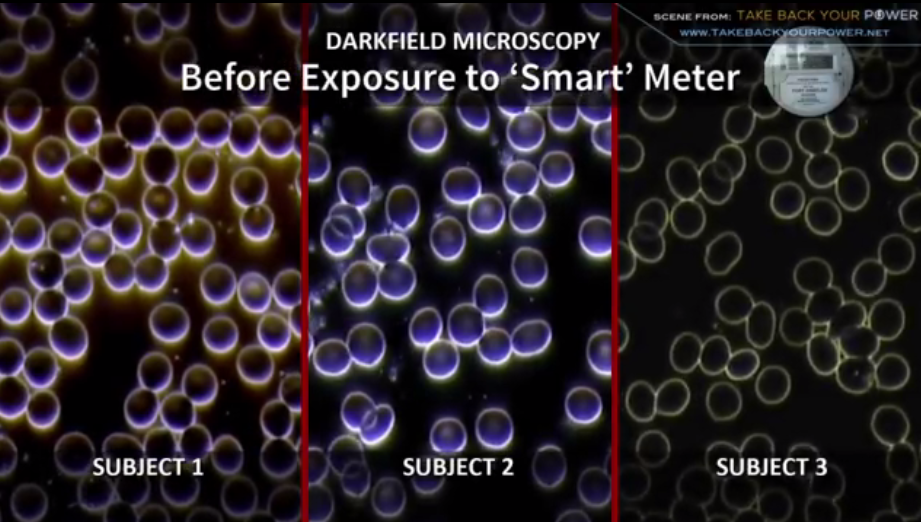
For those who wonder if there are any health issues or problems from exposure to Smart Meters and the electromagnetic frequencies they emit, here is a short video which shows three samples of blood examined using a Darkfield Microscope.

  https://www.youtube.com/watch?feature=player_detailpage&v=y4JDEspdx58#t=5
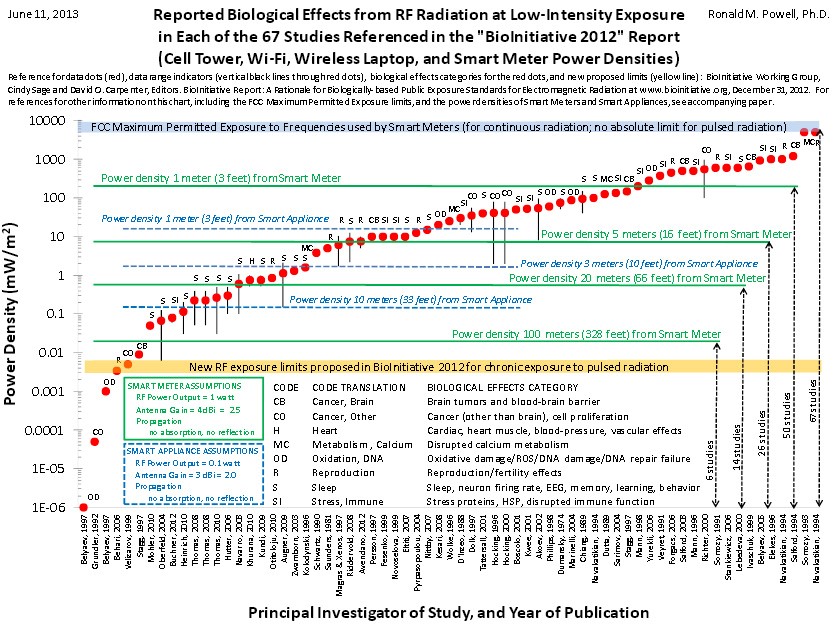
 
The video is self-explanatory, as the samples clearly show morphological responses or reactions. That kind of constant exposure with apparent human cellular morphological reactions—as will happen when a Smart Meter is placed on a dwelling—undoubtedly occurs, as EMFs/RFs are emitted 24/7/365. Consequently, it will be only a matter of time, depending upon each individual’s electromagnetic sensitivities threshold, before adverse health consequences materialize. Below is a chart created by EMF researcher Ronald M. Powell, PhD, which is self-explanatory? [3]

 
exposure chart


  The above graphic shows that 67 peer-reviewed, repeated studies show significant health issues (e.g. cancer, tumors, infertility) at levels far below the government safety standards (gray line). The yellow line is what the standards should be if public safety is considered. Source

 In another paper, “Electronicmagnetic Field Interactions With the Human Body: Observed Effects and Theories,” (NASA, April 1981) presented to the Goddard Space Flight Center, Greenbelt, Maryland 20771, on page 23, we find this:


Adverse, Benign, and Curious Effects The effects listed and/or discussed in this section relate to at least three of the five senses (touch, hearing, and sight) and nearly every system of the human body (including circulatory, digestive, nervous, and muscular). Many of them are temporary; however, some result in death and persistent disease. Some are better understood and more widely accepted than others. [1] [CJF emphasis added]


In 1981, NASA knew of numerous health problems, which are now classified as “Non-Thermal Health Effects,” which were cited on page 30 of that report:


  • Headaches
  • Eyestrain
  • Fatigue
  • Dizziness
  • Disturbed sleep at night
  • Sleepiness in daytime
  • Moodiness
  • Irritability
  • Unsociability
  • Hypochondriac reactions
  • Feelings of fear
  • Nervous tension
  • Mental depression
  • Memory impairment
  • Pulling sensation in the scalp and brow
  • Loss of hair
  • Pain in muscles and heart region
  • Breathing difficulties
  • Increased perspiration of extremities
  • Difficulty with sex life


  Read More Here


   .............................................................................................  


How to Make A Smart Meter Cover

  ..........     ..........
Published on Mar 20, 2014
This video will show you how to make a Smart Meter Cover if you have concerns about the health and safety standards of Smart Meter radiation. This faraday cage will significantly decrease the power level signals coming out the front and back of the smart meter. Using a mesh screen (aluminum or galvanized steel) will allow enough of the signal to pass so that your utility company can still read the meter.
  ..........

Sunday, November 29, 2015

In the last few weeks NASA has revealed the overall amount of ice has increased at the Antarctic and the amount of sea ice has also extended. ANTARCTIC temperatures have cooled over the past six years, study finds.


GLOBAL WARMING? NASA says Antarctic has been COOLING for past SIX years

ANTARCTIC temperatures have cooled over the past six years, according to US space agency NASA.


PUBLISHED: 07:51, Sat, Nov 28, 2015 | UPDATED: 12:58, Sat, Nov 28, 2015
 
Heimdal Glacier in southern Greenland, in an image captured on Oct. 13, 2015, from NASA Langley Research Center's Falcon 20 aircraft flying 33,000 fee 

NASA

Heimdal Glacier southern Greenland, from NASA's Falcon 20 aircraft at 33,000 feet above sea level.
An intensive scientific study of both Earth's poles has found that from 2009 to 2016 overall temperature has dropped in the southern polar region.NASA’s Operation IceBridge is an airborne survey of polar ice and has finalised two overlapping research campaigns at both the poles.In the last few weeks NASA has revealed the overall amount of ice has increased at the Antarctic and the amount of sea ice has also extended.Coupled with the latest announcement of slight cooling in the area, it has fuelled claims from climate change deniers that human industrialisation is not having the huge impact on global tenperature as often is claimed.
 
 
Map showing the extent of ice during the NASA studies 
NASA
Map showing the extent of ice during the NASA studies

Read More Here


.......................................................................................

Examiner.com

New paper claims no pause in warming, but unaltered data says otherwise

November 25, 2015 9:20 AM MST
Authors Naomi Oreskes (L) and Erik Conway attend the 'Merchants of Doubt' premiere during the 2014 Toronto International Film Festival.
Photo by Aaron Harris

Read More Here


Next: How NOAA rewrote climate data to hide global warming pause

...................................................................................................

Nasa Earth Observatory

Earth is Cooling…No It’s Warming


In 1967 Hansen went to work for NASA’s Goddard Institute for Space Studies, in New York City, where he continued his research on planetary problems. Around 1970, some scientists suspected Earth was entering a period of global cooling. Decades prior, the brilliant Serbian mathematician Milutin Milankovitch had explained how our world warms and cools on roughly 100,000-year cycles due to its slowly changing position relative to the Sun. Milankovitch’s theory suggested Earth should be just beginning to head into its next ice age cycle. The surface temperature data gathered by Mitchell seemed to agree; the record showed that Earth experienced a period of cooling (by about 0.3°C) from 1940 through 1970. Of course, Mitchell was only collecting data over a fraction of the Northern Hemisphere—from 20 to 90 degrees North latitude. Still, the result drew public attention and a number of speculative articles about Earth’s coming ice age appeared in newspapers and magazines.


Graph of Northern Hemisphere temperatures, 1860 through 1970

Initial efforts to observe Earth’s temperature were limited to the Northern Hemisphere, and they showed a cooling trend from 1940 to 1970 (jagged line). Scientists estimated the relative effects of carbon dioxide (warming, top curve) and aerosols (cooling, bottom curve) on climate, but did not have enough data to make precise predictions. (Graph from Mitchell, 1972.)


But other scientists forecasted global warming. Russian climatologist Mikhail Budyko had also observed the three-decade cooling trend. Nevertheless, he published a paper in 1967 in which he predicted the cooling would soon switch to warming due to rising human emissions of carbon dioxide. Budyko’s paper and another paper published in 1975 by Veerabhadran Ramanathan caught Hansen’s attention. Ramanathan pointed out that human-made chlorofluorocarbons (or CFCs) are particularly potent greenhouse gases, with as much as 200 times the heat-retaining capacity of carbon dioxide. Because people were adding CFCs to the lower atmosphere at an increasing rate, Ramanathan expressed concern that these new gases would eventually add to Earth’s greenhouse effect and cause our world to warm. (Because CFCs also erode Earth’s protective ozone layer, their use was mostly abolished in 1989 with the signing of the Montreal Protocol.)


.................................................................................................

This graph, based on the comparison of atmospheric samples contained in ice cores and more recent direct measurements, provides evidence that atmospheric CO2 has increased since the Industrial Revolution. (Source: [[LINK||http://www.ncdc.noaa.gov/paleo/icecore/||NOAA]])
This graph, based on the comparison of atmospheric samples contained in ice cores and more recent direct measurements, provides evidence that atmospheric CO2 has increased since the Industrial Revolution. (Credit: Vostok ice core data/J.R. Petit et al.; NOAA Mauna Loa CO2 record.)
 
The Earth's climate has changed throughout history. Just in the last 650,000 years there have been seven cycles of glacial advance and retreat, with the abrupt end of the last ice age about 7,000 years ago marking the beginning of the modern climate era — and of human civilization. Most of these climate changes are attributed to very small variations in Earth’s orbit that change the amount of solar energy our planet receives.

Scientific evidence for warming of the climate system is unequivocal.
- Intergovernmental Panel on Climate Change

The current warming trend is of particular significance because most of it is very likely human-induced and proceeding at a rate that is unprecedented in the past 1,300 years.1
 
Earth-orbiting satellites and other technological advances have enabled scientists to see the big picture, collecting many different types of information about our planet and its climate on a global scale. This body of data, collected over many years, reveals the signals of a changing climate.


Read More Here


The evidence for rapid climate change is compelling:


  • Republic of Maldives: Vulnerable to sea level rise
    Photograph by Shahee Ilyas  
    Malé, capital of Maldives  Wikipedia.org

    Sea level rise

    Global sea level rose about 17 centimeters (6.7 inches) in the last century. The rate in the last decade, however, is nearly double that of the last century.4
    + expand


  • Global temperature rise

    All three major global surface temperature reconstructions show that Earth has warmed since 1880.5 Most of this warming has occurred since the 1970s, with the 20 warmest years having occurred since 1981 and with all 10 of the warmest years occurring in the past 12 years.6 Even though the 2000s witnessed a solar output decline resulting in an unusually deep solar minimum in 2007-2009, surface temperatures continue to increase.7
     
    + expand


  • Warming oceans

    The oceans have absorbed much of this increased heat, with the top 700 meters (about 2,300 feet) of ocean showing warming of 0.302 degrees Fahrenheit since 1969.8
     
    + expand


  • Flowing meltwater from the Greenland ice sheet

    Shrinking ice sheets

    The Greenland and Antarctic ice sheets have decreased in mass. Data from NASA's Gravity Recovery and Climate Experiment show Greenland lost 150 to 250 cubic kilometers (36 to 60 cubic miles) of ice per year between 2002 and 2006, while Antarctica lost about 152 cubic kilometers (36 cubic miles) of ice between 2002 and 2005.

    + expand
Read More Here

Wednesday, March 19, 2014

Nasa-funded study: industrial civilisation headed for 'irreversible collapse'?


Friday 14 March 2014 14.28 EDT

Natural and social scientists develop new model of how 'perfect storm' of crises could unravel global system
This NASA Earth Observatory released on
This Nasa Earth Observatory image shows a storm system circling around an area of extreme low pressure in 2010, which many scientists attribute to climate change. Photograph: AFP/Getty Images
A new study sponsored by Nasa's Goddard Space Flight Center has highlighted the prospect that global industrial civilisation could collapse in coming decades due to unsustainable resource exploitation and increasingly unequal wealth distribution.
Noting that warnings of 'collapse' are often seen to be fringe or controversial, the study attempts to make sense of compelling historical data showing that "the process of rise-and-collapse is actually a recurrent cycle found throughout history." Cases of severe civilisational disruption due to "precipitous collapse - often lasting centuries - have been quite common."
The research project is based on a new cross-disciplinary 'Human And Nature DYnamical' (HANDY) model, led by applied mathematician Safa Motesharri of the US National Science Foundation-supported National Socio-Environmental Synthesis Center, in association with a team of natural and social scientists. The study based on the HANDY model has been accepted for publication in the peer-reviewed Elsevier journal, Ecological Economics.
It finds that according to the historical record even advanced, complex civilisations are susceptible to collapse, raising questions about the sustainability of modern civilisation:
"The fall of the Roman Empire, and the equally (if not more) advanced Han, Mauryan, and Gupta Empires, as well as so many advanced Mesopotamian Empires, are all testimony to the fact that advanced, sophisticated, complex, and creative civilizations can be both fragile and impermanent."
By investigating the human-nature dynamics of these past cases of collapse, the project identifies the most salient interrelated factors which explain civilisational decline, and which may help determine the risk of collapse today: namely, Population, Climate, Water, Agriculture, and Energy.
These factors can lead to collapse when they converge to generate two crucial social features: "the stretching of resources due to the strain placed on the ecological carrying capacity"; and "the economic stratification of society into Elites [rich] and Masses (or "Commoners") [poor]" These social phenomena have played "a central role in the character or in the process of the collapse," in all such cases over "the last five thousand years."
Currently, high levels of economic stratification are linked directly to overconsumption of resources, with "Elites" based largely in industrialised countries responsible for both:
"... accumulated surplus is not evenly distributed throughout society, but rather has been controlled by an elite. The mass of the population, while producing the wealth, is only allocated a small portion of it by elites, usually at or just above subsistence levels."
The study challenges those who argue that technology will resolve these challenges by increasing efficiency:
"Technological change can raise the efficiency of resource use, but it also tends to raise both per capita resource consumption and the scale of resource extraction, so that, absent policy effects, the increases in consumption often compensate for the increased efficiency of resource use."
Productivity increases in agriculture and industry over the last two centuries has come from "increased (rather than decreased) resource throughput," despite dramatic efficiency gains over the same period.


Read More Here
Enhanced by Zemanta